SolarWinds CPU Load Monitor

SolarWinds CPU Load Monitor

Starts from $1495 per year

SolarWinds CPU Load Monitor Review for Windows 10/11

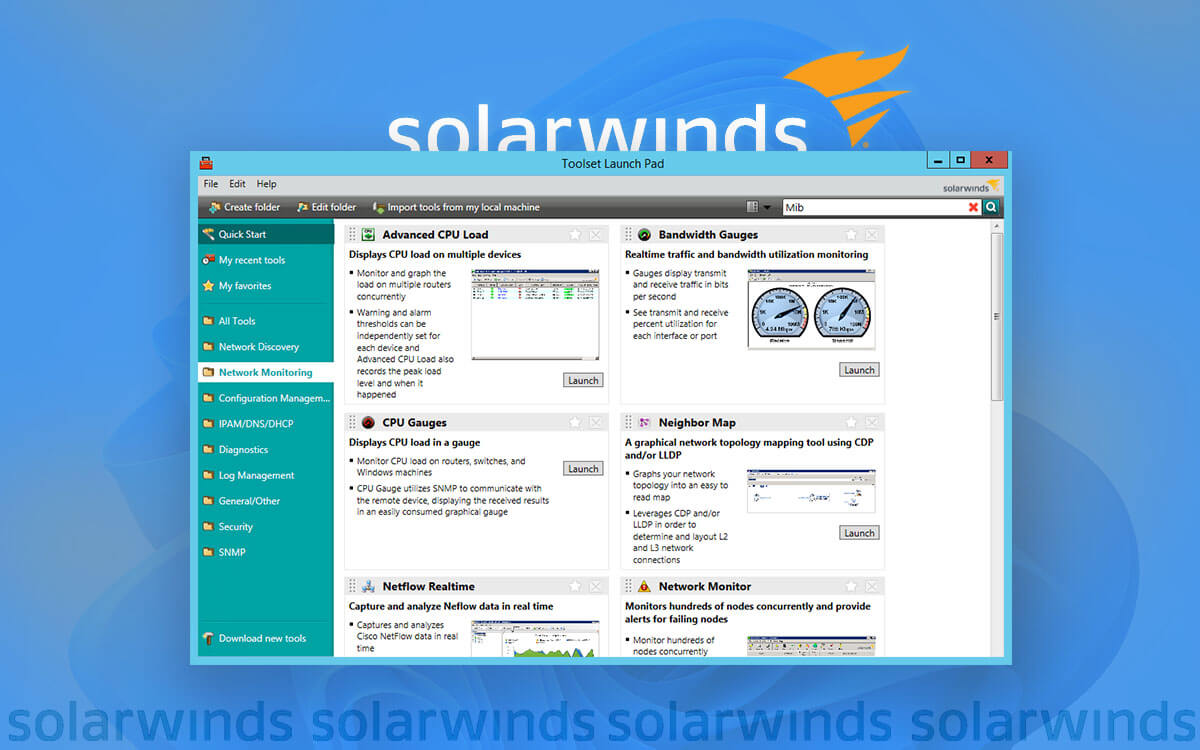
Do you often need to overclock your CPU while gaming? Or, are you in charge of managing network devices and are often worried about the CPU load and many related metrics such as temperature, memory, and others? How about monitoring CPU load using a tool? Here we are going to review SolarWinds CPU Load Monitor, an application trusted by users across several domains.

SolarWinds CPU Load Monitor

Starts from$ 1495 per year
Free Trial

What is SolarWinds CPU Load Monitor?

As the name suggests SolarWinds CPU Load Monitor is a tool that can help analyze CPU performance metrics. Processor time, CPU load (processes that are being used or queued up), CPU temperature, idle time, speed, and many other metrics for your computer.

It is a great tool for a business whose network devices are exposed to a large number of viruses which in turn increase traffic load and CPU resources. By setting thresholds for crucial CPU metrics you can be informed about issues beforehand and then you can take necessary actions.

Pros:

  • Set the warning and alarm thresholds
  • Free trial available
  • Monitor load on multiple Cisco routers

Cons:

  • Only compatible with Windows.

interface

85% - Very Good

The Engineer’s Toolset consists of both web-based and desktop tools. These can be used to configure and monitor load for multiple devices in real time and set warning and alarm thresholds for each device independently. 

The web interface consists of five tools – TraceRoute, Interface Monitor, CPU Monitor, Memory Monitor and Response Time Monitor. The CPU Monitor uses the SNMP or local communication protocols to analyze capacity and current CPU utilization for remote Windows systems, locally monitored devices, and any other networked devices.  

You can even access the desktop tools that give you a basic yet easy-to-understand and customizable interface. where you get tools to monitor devices and take necessary actions. 

Features

85% - Very Good

1. Monitor Critical Metrics

Critical performance metrics such as errors, uptime, and CPU response time are important to pinpoint performance issues. These can be very helpful when troubleshooting issues. SolarWinds CPU Load Monitor helps track and graph the load for various devices on your computer. It also includes an efficient auto-discovery feature with the help of which new devices can be checked. This can further help reduce configuration and update time.

2. CPU Temperature Monitoring

solarwinds review

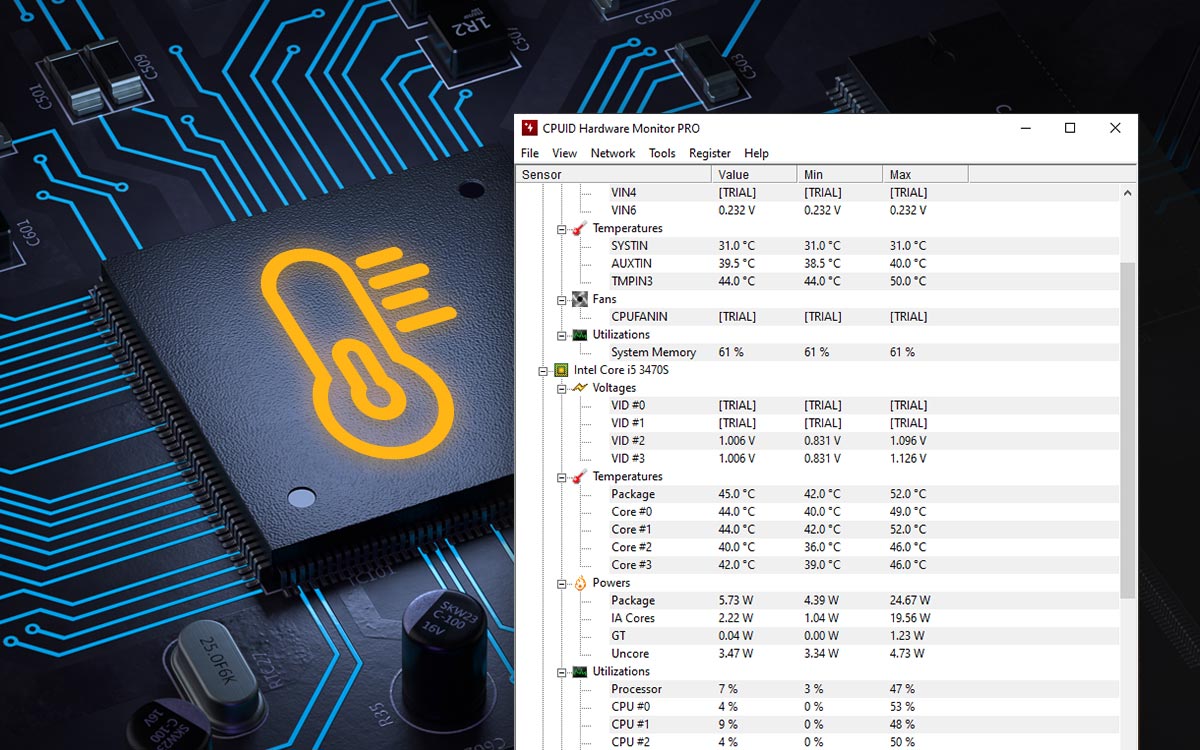
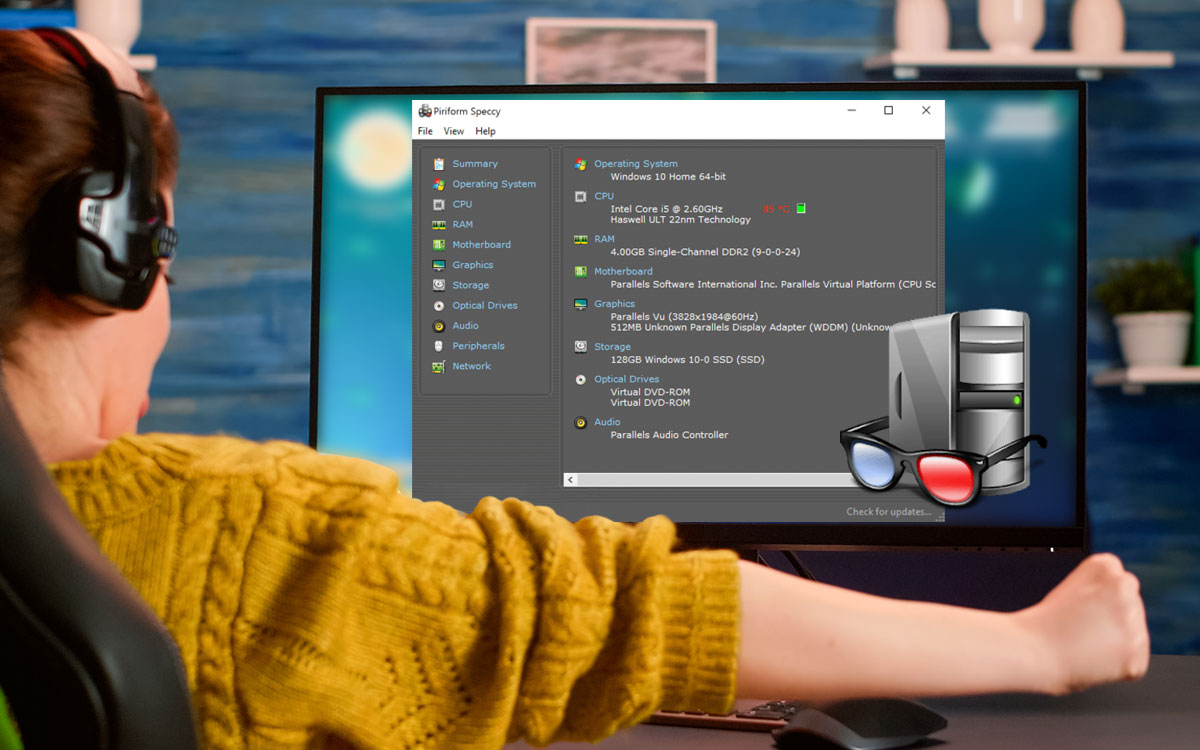
When handling various devices with CPU, it is important that you are aware of their temperature. That’s because overheating can cause your device to slow down or worse shut down. SolarWinds Engineer’s Toolset automates the process of finding which of the CPUs have high temperatures and which are on the verge of slowing down, thanks to the auto-discovery feature. Apart from temperature, you can also have a look at other metrics such as CPU load, performance, and memory.

3. Set Alarms and Warnings

system load monitor

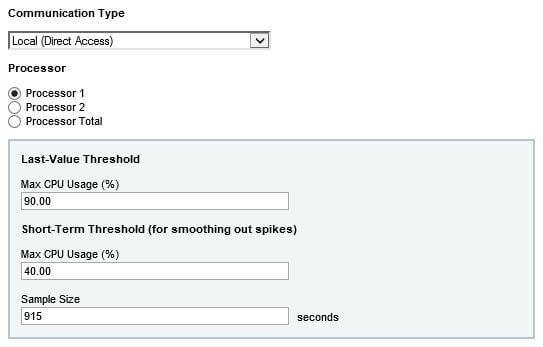
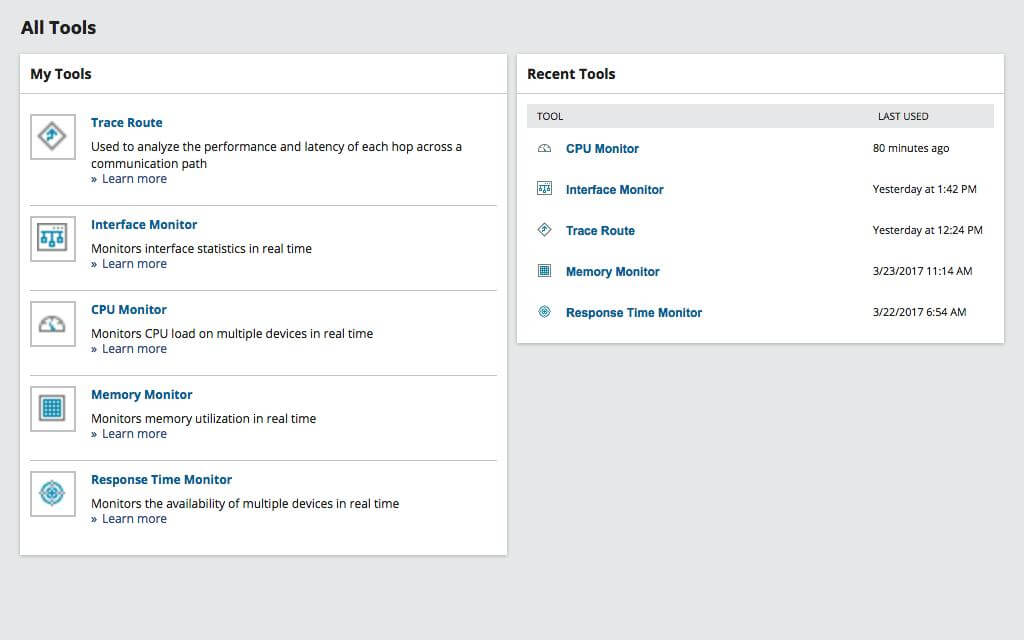
With ETS SolarWinds CPU Load Monitor, you can define specific thresholds for crucial CPU monitoring metrics. These include memory utilization, disk space, processor time, and many others. Under normal circumstances, you have to manually keep tabs on these thresholds.  ETS is designed in a way that it removes any manual, round-the-clock monitoring and instead sends alerts to you via SMS or email. This way you can act upon the issue as and when required. 

4. Prevent Overload

The monitoring software comes with a CPU load monitor that tracks metrics. It includes memory utilization, interface statistics, and other metrics in real time and displays them in an intuitive yet easy-to-understand dashboard. In the case of multiple routers, customizable reporting tools let you monitor and graph them. You can also examine more granular and minute metrics such as minimum, maximum and average load. 

5. CPU Gauge Tools

These tools help monitor CPU load on switches, routers, and end-user workstations. To communicate with each remote device, the CPU gauge uses SNMP protocol and displays results graphically. You can customize things as per the specifications you need.

6. Track Router Load

SolarWinds Router CPU Load tool can help you monitor the CPU load for multiple Cisco routers in real-time. The load for every router is shown in a horizontal bar. You can then match the current load as opposed to the maximum CPU load. Again, you can specify thresholds for each router and whenever that threshold is bypassed, you’ll be notified immediately.

Updates

80% - Good

New features and fixes for common issues are released by the way of upgrades. For instance, with Engineer’s Toolset 2022.4.1 more stability fixes have been provided. If you have Engineer’s Toolset for Desktop version 11.0.6 or later, you can directly upgrade to the latest version by heading to the official support page. For the earlier version, you can use the upgrade path mentioned in the screenshot below – 

solarwinds cpu load monitor

Pricing

70% - Good

Considering the fact that SolarWinds CPU load monitor comes under SolarWinds Engineer’s Toolset, the price of the whole software is competitive and starts at $1728. You also get a fully functional trial for a period of 14 days. The trial link is sent to you once you fill in a form with details such as name, company name, STD code, email ID, etc. However, if just the CPU load monitor tool is concerned, it is on the pricier end

Customer Support

85% - Very Good

SolarWinds has a dedicated customer portal where you can get your issues resolved promptly. Here you can – 

  • Download SolarWinds software. 
  • Manage licenses and in case you have lost license keys, restore them as well.
  • Create and track support tickets related to your issues. 
  • Learn about software via live and on-demand training. 

In fact, you can even contact representatives via live chat where your problems are addressed immediately, and should you face issues in the functionality of the tool, you can even ask for professional assistance.

solarwinds cpu load monitor editor's choice

How To Use SolarWinds CPU Load Monitor?

1. Get SolarWind Engineer’s Toolset here.

2. Click on the Devices in the toolbar. 

3. Click on the device you want to monitor. 

4. Head back to the toolbar, click on Add and then click on Add New Monitor

5. In the Select Monitor page, click on CPU Usage

6. Enter the details of the server. 

solarwinds review

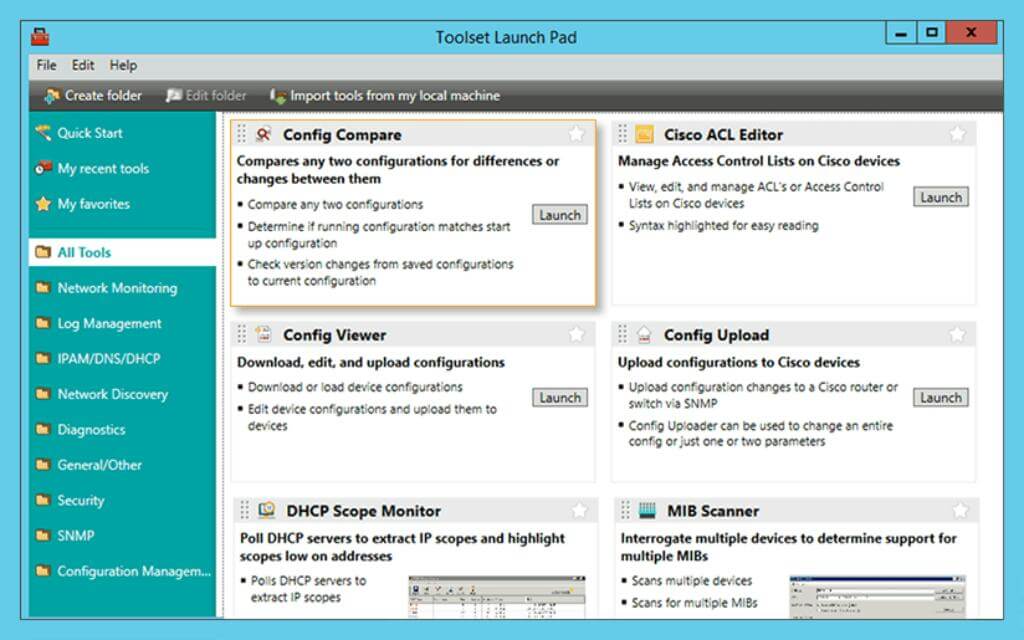
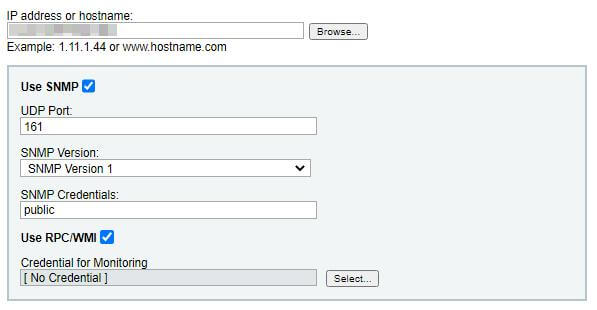
Here are the things you will be required to mention – 

1. IP address or hostname of the server you want to monitor. 

2. Click on the SNMP checkbox if the monitor will interact with an SNMP-enabled device.

3. UDP port number of the device. The default port is 161. 

4. SNMP version.

5. SNMP credentials

6. Click on the RPC/ WMI checkbox to enable communication between the monitor and the targeted server (if needed)

7. Click on Next. 

8. Choose monitoring thresholds. 

solarwinds cpu load monitor download

9. Click on Next. 

10. Create the new drive space monitor and select appropriate checkboxes.

11. Click on Create

Wrapping Up

In the end, we’d like to reinstate that for troubleshooting network devices, SolarWinds Engineer Toolset by itself is a spectacular tool. And, among various issues, if managing CPU load and other resources is your concern, this tool is highly recommended. If you are an existing user, do share your experience in the comments section below. For more such content – software reviews and listicles, keep reading Top10PCSoftware. 

Frequently Asked Questions –

Q1. How do you calculate CPU load?

You can take the assistance of SolarWinds CPU Load monitor which is capable of monitoring all CPU usage metrics and not just that it even lets you set thresholds.

Q2. How do I monitor all CPU cores?

To check all CPU cores, press Ctrl + Shift + Esc to open the Task Manager. Click on the Performance tab. Then click on CPU and check how many cores and logical processors your PC has.

Q3. What is SolarWinds Engineer’s Toolset?

It is a collection of over 60 tools that let you monitor, discover, and troubleshoot issues on your network. For instance, you can easily analyze and set thresholds for various CPU monitoring metrics such as uptime, temperature, memory, idle time, speed, and many others. 

Q4. How to resolve high CPU load in SolarWinds NPM service?

The best way to resolve the high CPU load in SolarWinds NPM service is to delete all files from the Windows temp directory on the Orion Server. You can find it in c:\windows\temp windows temp

Write A Review

Your email address will not be published. Required fields are marked *

This site uses Akismet to reduce spam. Learn how your comment data is processed.